

August 17th, 2026
By Lotem Sella, CFA
In the world of finance there are many rules of thumb. What should your investment portfolio look like? 60% stocks and 40% bonds sounds reasonable. What should the Federal Reserve target for the rate of inflation? 2% is about right. And when it comes to taking money out of your portfolio, the prevailing rule of thumb is a 4% annual withdrawal rate.
The 4% rule was popularized by William Bengen’s Determining Withdrawal Rates Using Historical Data, in a paper that focused on historical withdrawal rates, asset allocation schemes, and how certain periods produced significantly different retirement outcomes. Understanding these interacting forces is important to investors who wish to minimize the likelihood of both under and overspending in retirement.
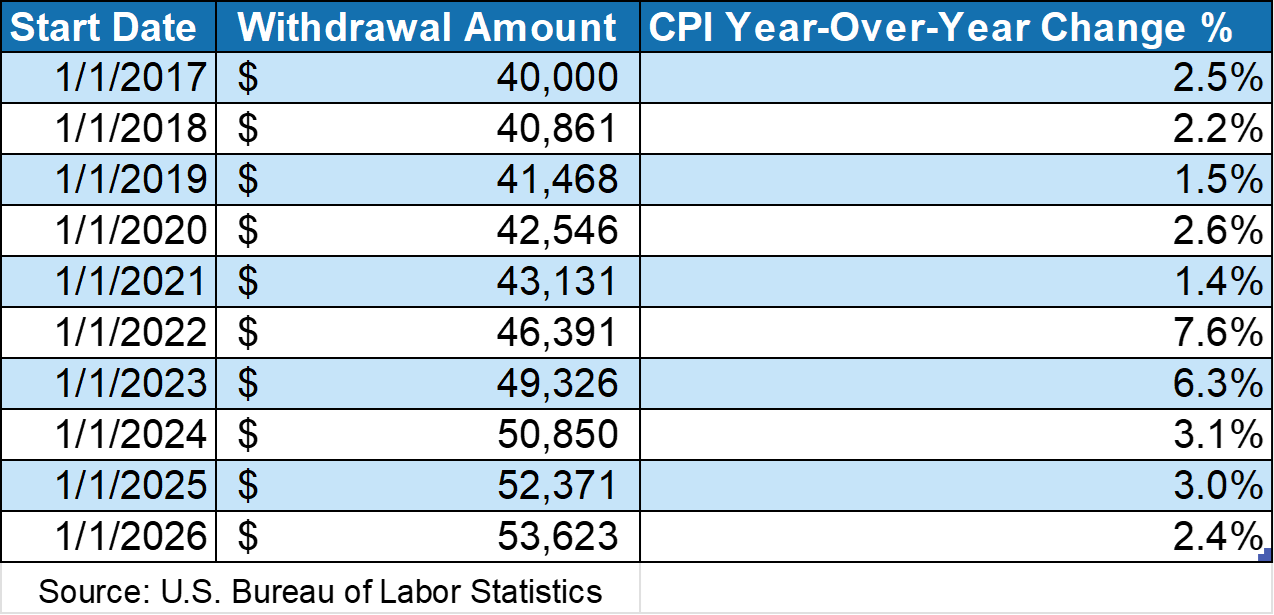
Okay, first what is the 4% rule? Bengen describes it as the initial withdrawal rate an investor takes from their nest egg before adjusting annually by inflation. That last word is key as many people have incorrectly assumed that the 4% withdrawal rate grows alongside a portfolio’s value. Instead, 4% is simply the starting point. For reference, the table below illustrates how a portfolio starting with a $1M would have made distributions for the past 10 years under this strategy:
Great, so that’s the rule, but why was 4% chosen? 5% sounds nicer, why not go with that number? The rationale rests with failure rates as measured by the frequency of retirement funds not lasting for at least 35 years. By using historical data for both the stock and bond markets, Bengen backtested portfolios with allocations of 50% equities and 50% fixed income. He then asked the question of how long this portfolio would last for an investor beginning retirement in 1926 with a 3% withdrawal rate. This question was repeated for the person retiring in 1927 and again for the one in 1928 and so on and so forth until the dataset exhausted itself.
When he finished his calculations, he found that with a 3% withdrawal rate, every single historical portfolio lasted for at least 50 years. Obviously, this is far too conservative as most retirees do not live for that long and would benefit from taking out more. Thus, the next withdrawal rate was tested at 4%, which showed the lowest historical portfolio life was 35 years. Assuming you retire at 65, that means your portfolio will continue supporting withdrawals through the age of 100 based on the historical dataset.
However, the same longevity studies could not be replicated for higher starting withdrawal rates. The worst outcome for a 5% rate was 20 years, with portfolio lives decreasing as withdrawal rates increased. At face value, this is all intuitive. Of course, your portfolio won’t last as long if you take too much out! But the exact rate is a more beneficial starting point than taking out what “feels right.” In that context, asset allocation should be explored more carefully too.
For his study, Bengen reviewed different allocation ranges in 25% increments as shown below:
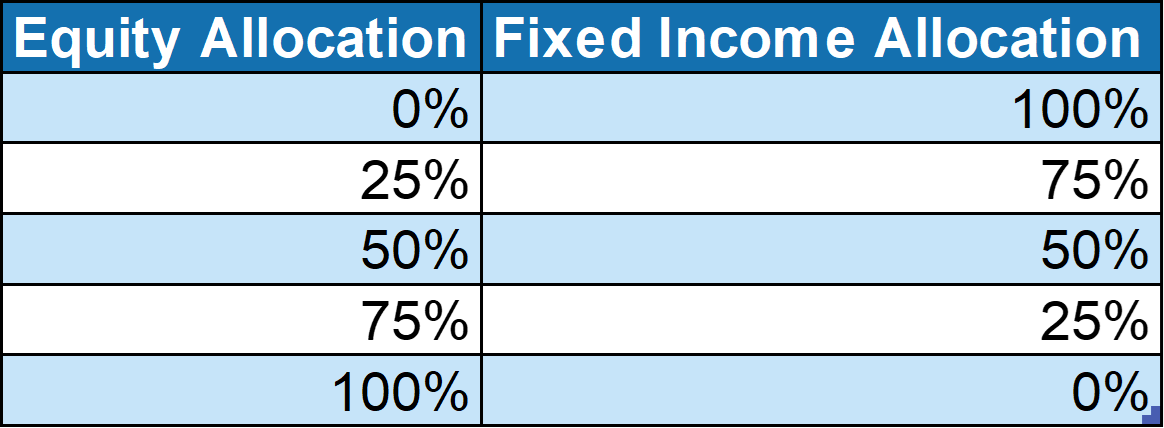
He found that portfolios ranging from 50% to 75% equity exposure were the sweet spots for sustainable withdrawal rates. This can be explained by the stock market’s historical tendency to outperform inflation compared to bonds:
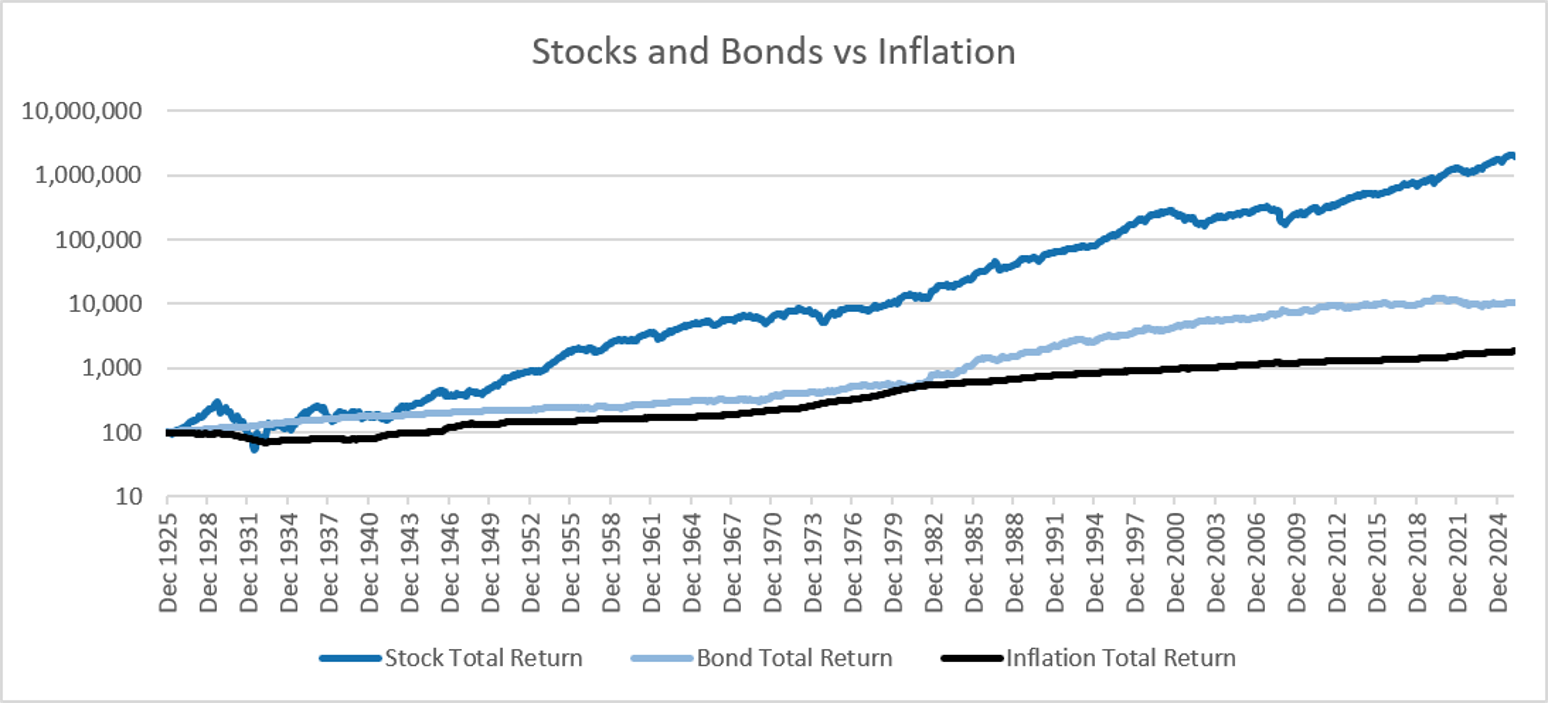
Source: Shiller Data
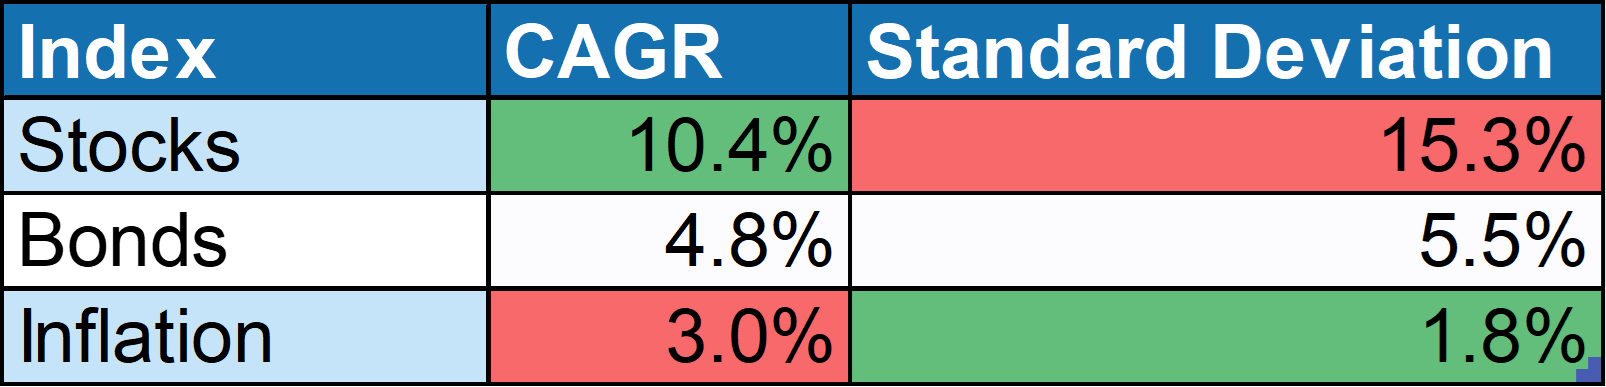
However, this return premium comes at the expense of higher risk as measured by standard deviation:
Source: Shiller Data
In Bengen’s study, he found that portfolios with less than 50% equity exposure had lower longevity rates, as they often failed to outperform inflation. Conversely, the 100% equity portfolio also had a shorter life, but this time due to higher volatility. This finding is supported by something known as “sequence-of-return” risk.
When you retire matters. If your last day on the job happened to be July 1982 and you started with a $1M 50/50 stock/bond portfolio that followed the 4% withdrawal rule, my calculations suggest it would have been worth $21M thirty-five years later. That’s a wonderful legacy to leave to your heirs, but it could have been much worse had you retired in November 1965. For this fateful retiree, their investment portfolio would have been extinguished twenty-five years later in 1990.
So, what gives? Why are two seemingly similar investors subject to such different outcomes?
In the first example, sequence-of-return risk played in the investors favor as the United States was coming out of a recession brought upon the Federal Reserve hiking interest rates with the effective federal funds rate reaching a record 22.4% in 1981. In this example, it works wonderfully to start retirement at the bottom of a market crash.
For the 1965 scenario, stocks had experienced a run up in prices for the prior decade, gaining 183% cumulatively. What followed was a 14% decline over the next year coupled with muted returns through the end of 1972, which saw stocks barely outperform inflation while bonds underperformed. Then, the “Nifty-Fifty” bubble imploded sending the stock market down 39% and leaving investors rattled by a financial pincer of lower asset prices and painfully high inflation. All told, by the end of the twenty-five-year period both stocks and bonds outperformed inflation, but the journey to get there was filled with volatility and many unfortunate events at the start of retirement.
Retirement income choices are more complicated than following a rule of thumb. Investors should consider taxes, social security timing, life cycle of spending habits, and many other factors when creating a long-term plan. One of the easiest things in investing is spending an afternoon building charts describing the past 100 years and saying, “see it works on average, you just need to wait it out.” The hardest part is living the chart day in and day out.
If you’re following Bengen’s rule of thumb, the 4% withdrawal rate is a reasonable place to start your retirement journey. But remember, investors aren’t confined to the decision they made at the start of retirement. Life evolves in unpredictable ways, and the best strategy is allowing yourself the flexibility to make changes as your financial landscape changes.
References
Bengen, William P. (1994). Determining Withdrawal Rates Using Historical Data. Journal of Financial Planning, Vol. 7, No. 4, pp. 171–180. Financial Planning Association. Available at: https://www.financialplanningassociation.org/sites/default/files/2021-04/MAR04%20Determining%20Withdrawal%20Rates%20Using%20Historical%20Data.pdf
Shiller, Robert J. U.S. Stock Markets 1871–Present and CAPE Ratio Data. Yale University. Available at: https://shillerdata.com/
U.S. Bureau of Labor Statistics. Consumer Price Index data
Board of Governors of the Federal Reserve System (US), Federal Funds Effective Rate [DFF], retrieved from FRED, Federal Reserve Bank of St. Louis. Available at: Federal Funds Effective Rate (DFF)
Methodology
The analysis presented in this article is based on William Bengen’s original withdrawal rate study and a separate review of publicly available historical market and inflation data.
Bengen’s original study tested retirement outcomes using historical returns for U.S. stocks and intermediate-term Treasury securities across different withdrawal rates and stock/bond allocations. References to Bengen’s findings, including the historical durability of 3%, 4%, and 5% withdrawal rates, are based on his published 1994 paper.
The examples included in this article use publicly available historical market data from Robert Shiller’s historical market database downloaded in August 2026, including U.S. stock market returns, dividends, long-term Treasury yields, and inflation data. Consumer Price Index data are used as the inflation adjustment for withdrawals.
The hypothetical retirement examples assume:
Initial portfolio value: $1,000,000
Initial withdrawal rate: 4.0%
Withdrawals adjusted for inflation
A simplified stock/bond portfolio using historical U.S. equity and Treasury bond data
No taxes, advisory fees, trading costs, investment expenses, or behavioral changes
No changes to withdrawals other than inflation adjustments
The examples are intended to illustrate how different starting dates and sequences of market returns can affect retirement outcomes. They are not intended to recreate every assumption from Bengen’s original study or to predict future investment performance.
The Federal Funds Effective Rate cited in the discussion of 1981 interest rates is sourced from the Board of Governors of the Federal Reserve System via FRED, Federal Reserve Bank of St. Louis.
Disclosure
This article is provided for educational and informational purposes only and should not be construed as investment, tax, legal, or financial planning advice.
The examples are hypothetical and based on historical data. Past performance does not guarantee future results. Future market returns, inflation, interest rates, tax rules, investment costs, and investor behavior may differ materially from the historical periods discussed.
The retirement examples use simplified assumptions and do not reflect the circumstances of any particular investor. Actual retirement income planning should consider factors such as life expectancy, taxes, Social Security claiming decisions, spending flexibility, healthcare costs, required minimum distributions, portfolio expenses, and personal risk tolerance.
References to William Bengen’s research and the 4% rule are intended to summarize historical findings. They should not be interpreted as a recommendation that any specific withdrawal rate, asset allocation, or retirement income strategy is appropriate for every investor.
