

October 5th, 2026
By Lotem Sella, CFA
Highlights:
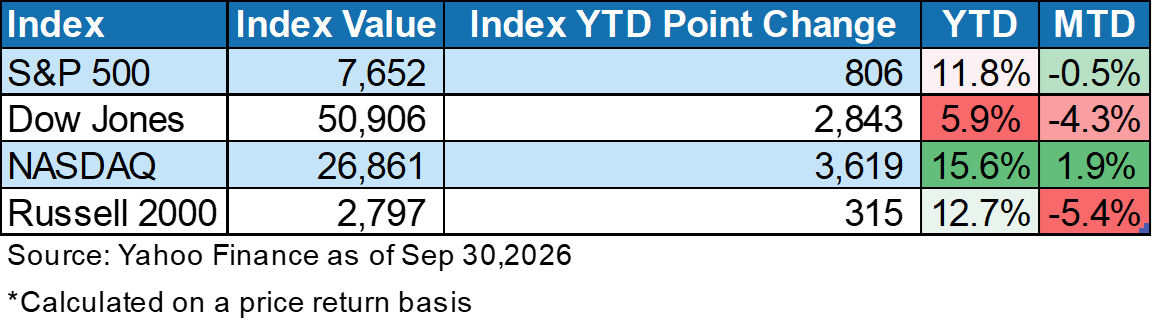
The stock market had a quiet month as measured by the S&P 500, but dispersion was high beneath the surface.
Bond yields continued to rise as the Federal Reserve hiked interest rates by 0.25%.
The “K-Shaped” economy bifurcates the experiences of Americans resulting in materially different outcomes.
With Q2 earnings season in the rearview mirror, September trading relied less on fundamental data to support monthly price action. Despite the lack of accounting catalysts, equities were driven by mean-reversion, a surge in bond yields, and indicators continuing to signal a “K-Shaped” economy. For October, investors will be on the lookout for the start of Q3 earnings season and a month that is historically more volatile during midterm election years.
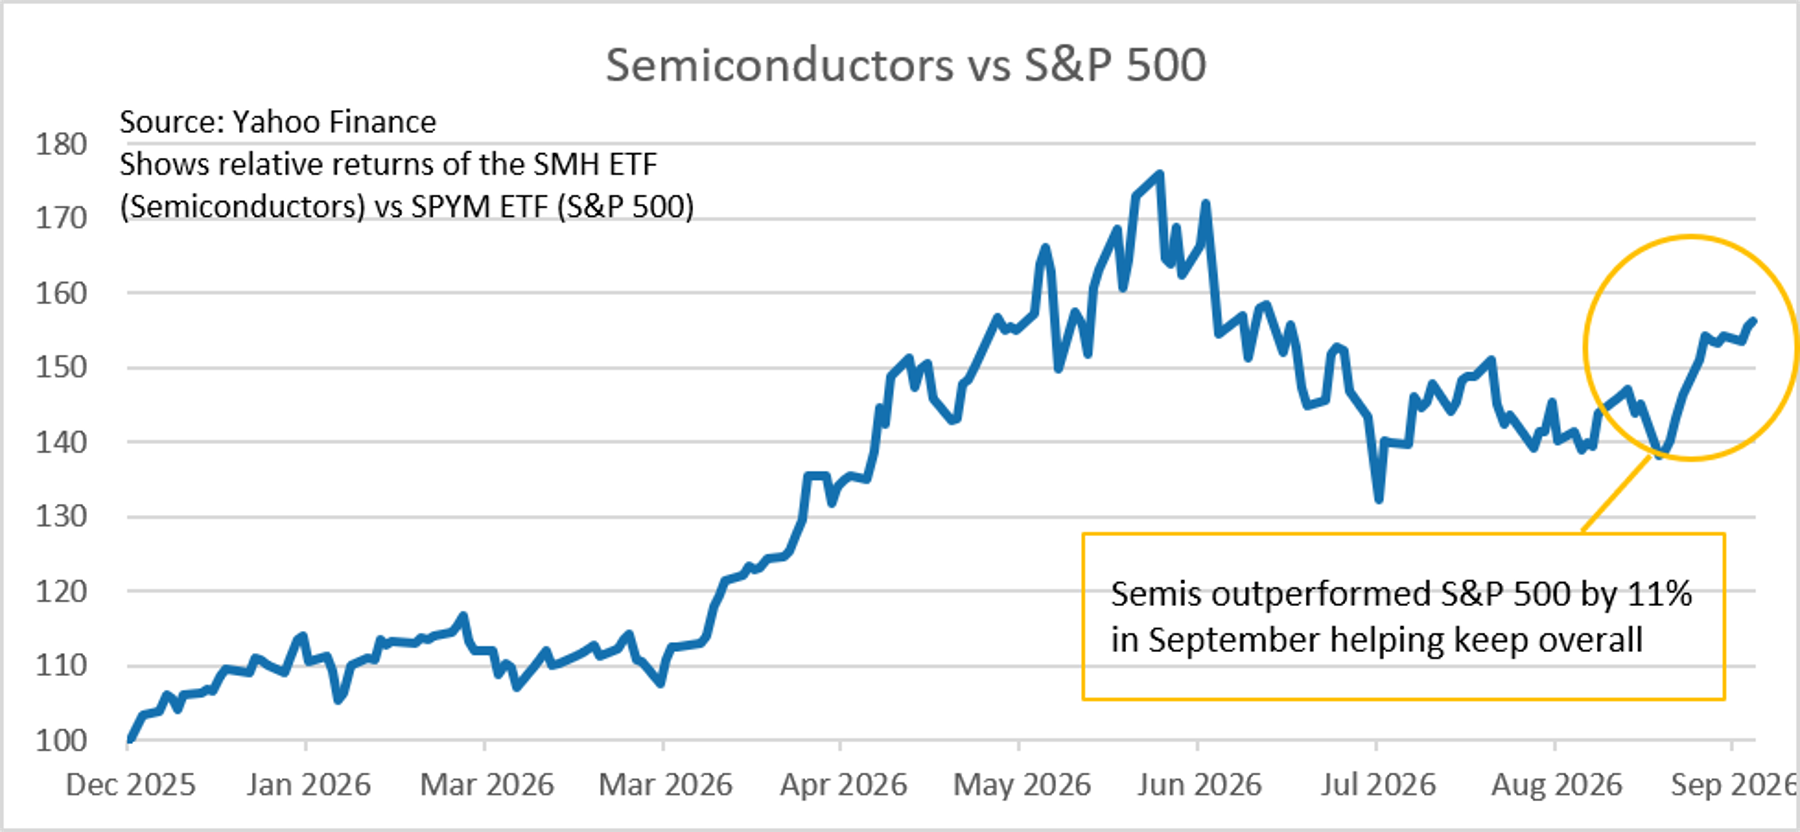
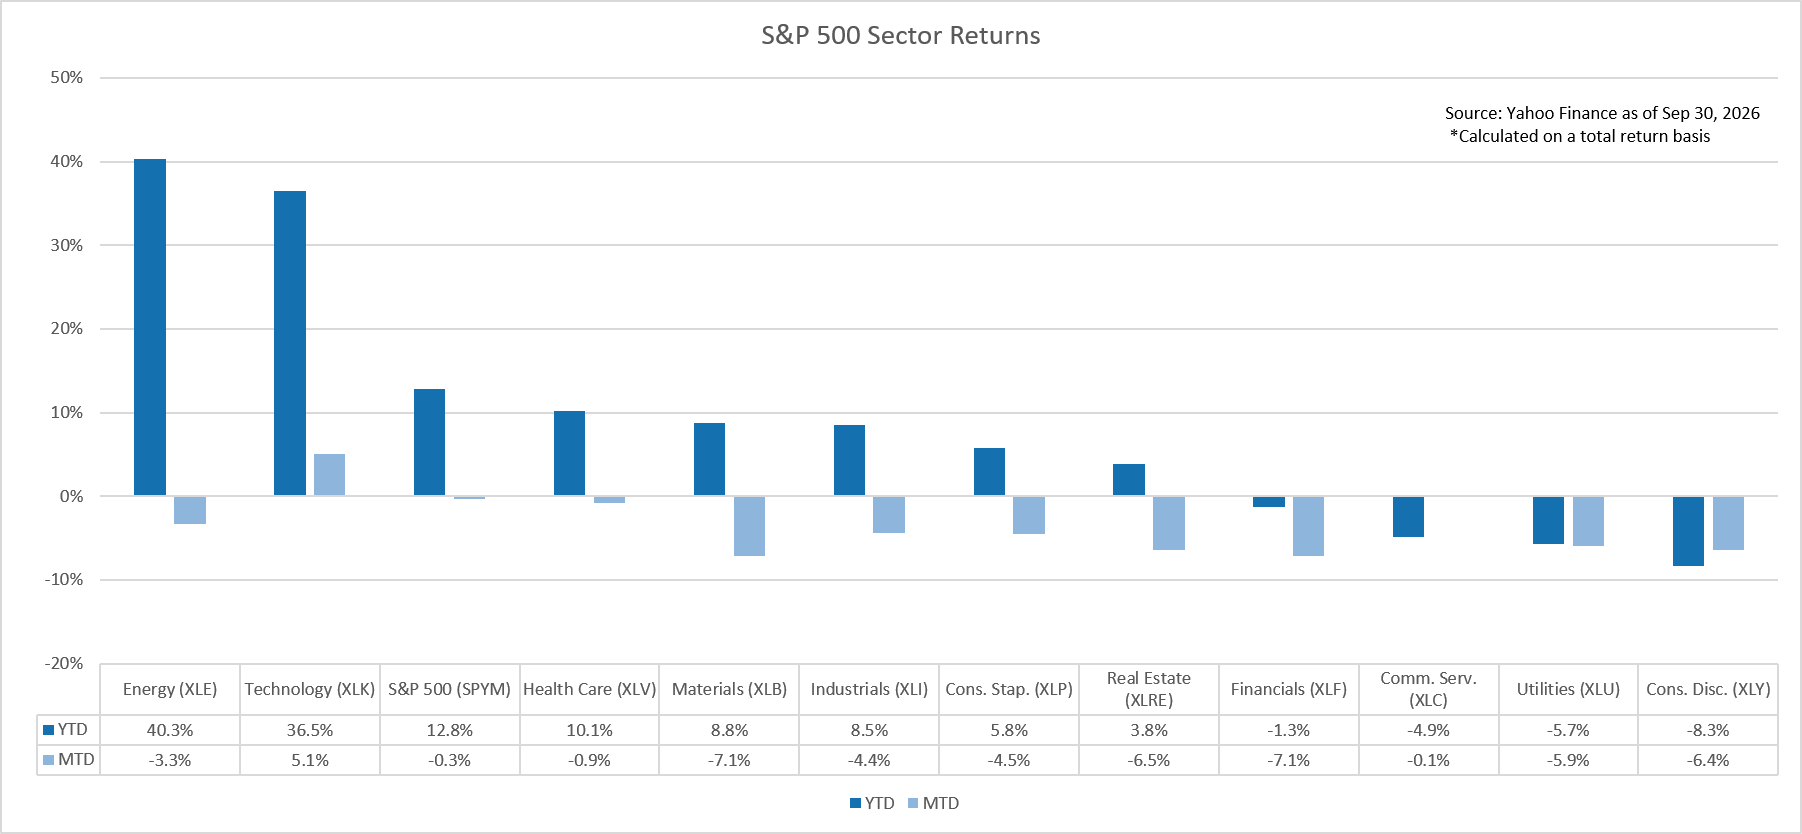
While the S&P 500 had a benign September as measured by a half percent loss, the underlying sectors driving returns were surprisingly negative. The worst performing sectors were Financials and Materials, both down 7.1%, as higher interest rates weighed on valuations Despite, the worrying returns across the investing complex, the Technology sector stood out with a 5.1% gain, driven primarily by Semiconductor companies, which outperformed the S&P 500 by 11% in September alone.
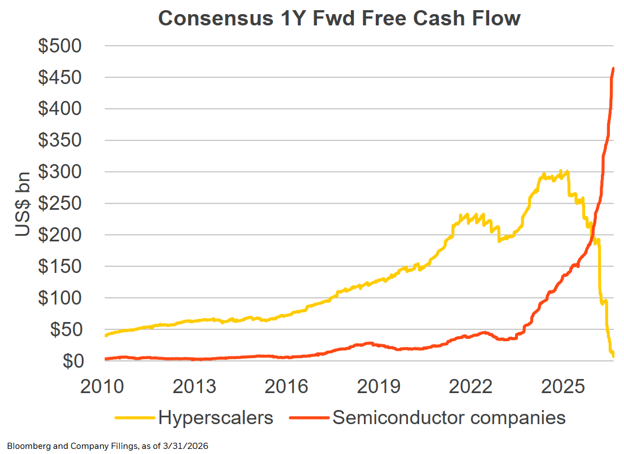
For the year, Semiconductors outperformed the market by 56% with companies like Micron leading the charge as investors reward memory chip firms who’ve seen strong demand for their products. This surge in demand has led to higher earnings, as Hyperscaler firms (broadly defined as Microsoft, Amazon, Alphabet, and Meta) spend record cashflows investing in the datacenters supporting the AI revolution. That spending has gone straight to the pockets of Semiconductor firms, who are selling the proverbial picks and shovels in today’s gold rush.
A consequence of September’s price action is the continued concentration of technology companies in the S&P 500. As a reminder, the S&P 500 is a market-cap weighted index meaning it assigns a higher weight to companies with a larger market valuation. For example, if company ABC is worth a billion dollars and company XYZ is worth nine billion dollars, the former would receive a 10% weighting and the latter 90%. This is important, because increasingly investors are accessing markets via passive funds that track indexes like the S&P 500, especially in work-place retirement plans such as 401(k)’s.
Through the end of September, the ten largest companies in the S&P 500 made up close to 40% of the index compared to ~18% in the mid-1990s. This concentration presents a risk that brings into question the ultimate diversification quality of the index, which is increasingly driven by the price action of a handful of technology companies. September shows the benefit of such concentration, with some arguing this is a feature and not a bug of investing. For example, from 1926 through 2025 just 46 firms were responsible for 50% of net wealth creation in the U.S. stock market [1]. This represents just 0.158% of all publicly traded companies since that time and expresses a recurring theme of a small cohort of wildly successful firms rising the tide that lifts all boats.
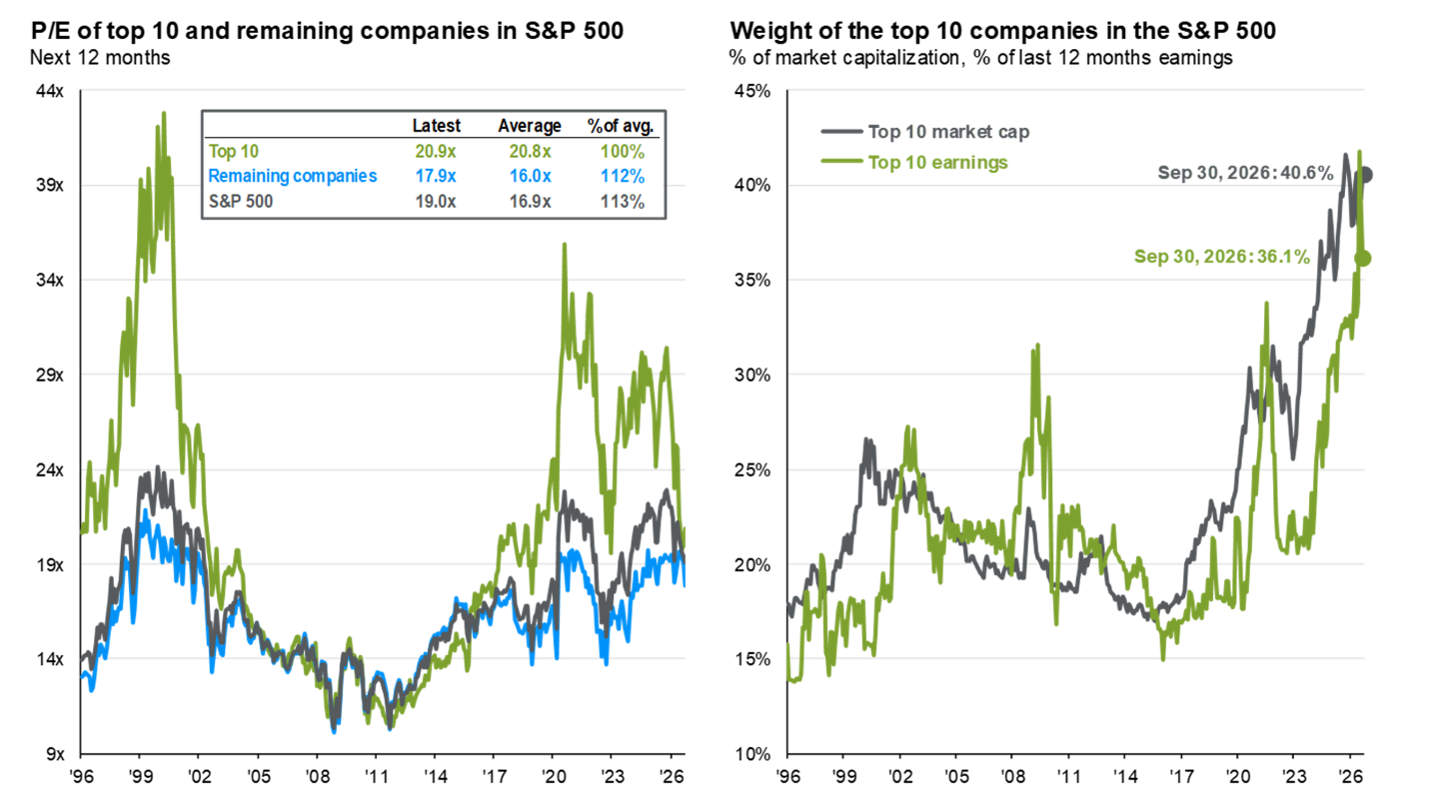
Source: FactSet, Standard & Poor’s, J.P. Morgan Asset Management.
Forward P/E ratio is the most recent price divided by consensus estimates for earnings in the next 12 months, provided by IBES since January 1996 and FactSet since January 2022. The remaining stocks represent the rest of the 490 companies in the S&P 500, and their P/E ratio is calculated by backing out the nominal earnings and market cap of the top 10 from that of the S&P 500.
Guide to the Markets – U.S. Data are as of September 30, 2026.
Wrapping commentary on the equity market brings us to the midterm elections. Historically, investing based on politics hasn’t been a worthwhile endeavor with eras defined by both Democrats and Republicans control yielding strong stock market returns. The success of the stock market is determined more by the innovation of entrepreneurs than by liberal or conservative policies.
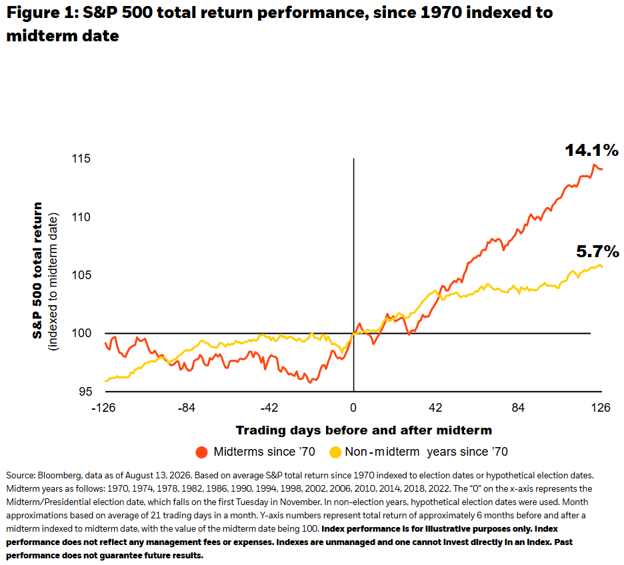
Still, most investors are likely to have a political opinion and depending on the most recent polling figures may be tempted to undergo bouts of greed or fear. This is especially pronounced in midterm election years when volatility as measured by the VIX index tends to increase during the months of September and October, according to analysis by JPMorgan. However, if history is to serve as a guide, the average return on the S&P 500 is 14% in the 6 months after the midterm election. It should be emphasized that an average contains outlier events that may or may not be repeated in this year’s election.
Moving to the bond market, September saw the Federal Reserve hike interest rates by 0.25% to a target range of 3.75% to 4.00%. This is the first interest rate hike since 2023 when inflation was surging on the back of supply-chain issues from the COVID led shutdown and subsequently the war in Ukraine. Today, like the last hike, sees an inflation rate higher than the Federal Reserve’s target for 2%. In his speech at Jackson Hole in August, Chairman Warsh stated; “Certain sectors—like housing and agriculture—are showing strains. But, on balance, I would be hard pressed to describe broad financial conditions as restrictive.” [2]
Estimates by PIMCO [3] describe financial conditions as “loose,” with the wealth effect from a surging stock market the main contributor. To “tighten” these conditions and bring inflation in line, the Federal Reserve has decided to increase interest rates. Whether or not they are trying to slow down the stock market is up for debate, however what can be said is how market participants have been pricing this event over the past year. Starting in October 2025, investors were pricing in a Fed Funds rate of ~3% by the end of 2026 (this can be accomplished by trading futures contracts). The implication being that through the course of 2026, the Fed would cut interest rates twice. Instead, the opposite has occurred and today the market is pricing in one more rate hike by year-end. Predictions are never easy, especially when they concern interest rates.
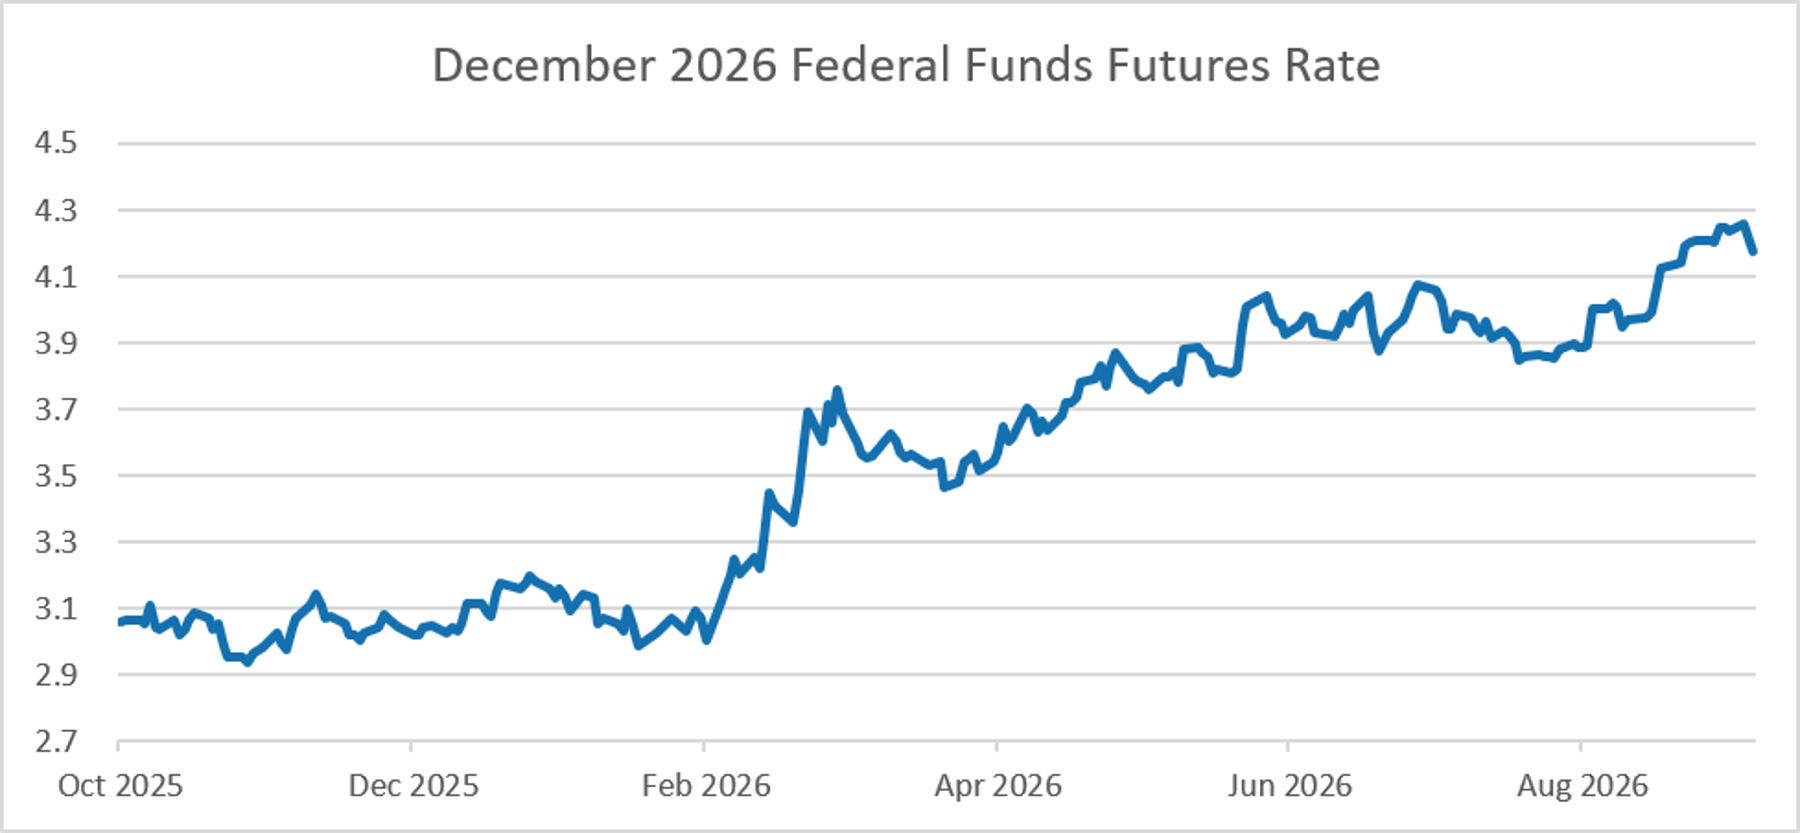
Source: CME FedWatch Tool
The impact of higher short-term interest rates set by the Federal Reserve has worked its way through the longer end of the curve as measured by the 10-year and 30-year treasury rates [4]. This in turn has impacted mortgage rates, which are now at about 7.3% compared to an annual low of 6.0% at the end of February. To put this move into context, researchers estimate that for every 1-percentage point decrease in interest rates, monthly mortgage costs fall by 10% [5]. To get home affordability back in line, interest rates would need to go the opposite direction.
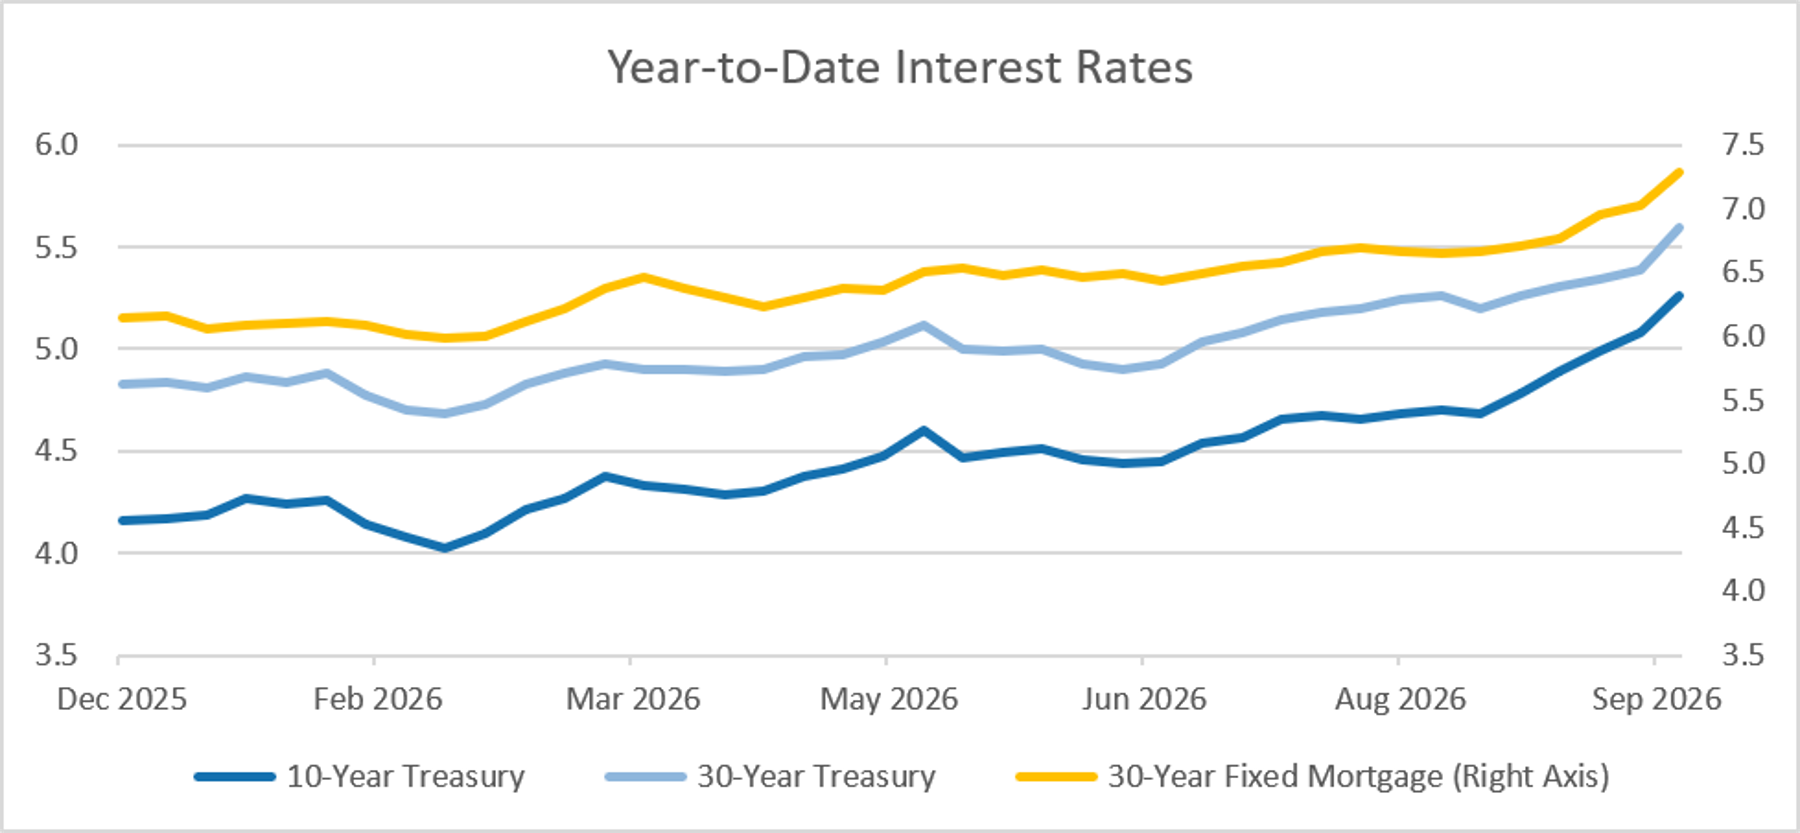
Source: Board of Governors of the Federal Reserve System, Freddie Mac
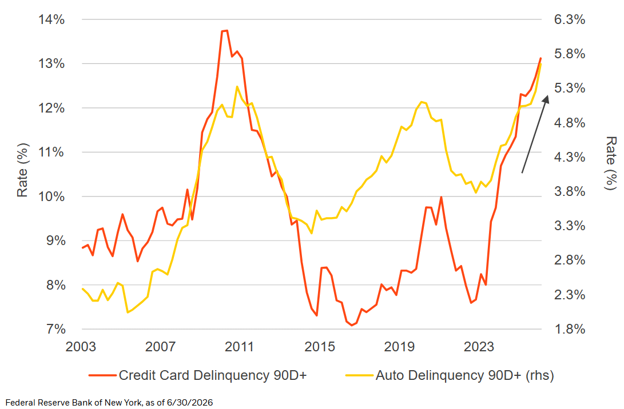
Increases in interest rates hurt lower-end consumer disproportionally, invoking a narrative of the “K-Shaped” economy. This theory suggests the economy has bifurcated in two separate paths of the haves and have nots. On the upper side of the “K” we see the wealthiest Americans holding up the economy with disproportionate consumption [6]. On the lower side, we see evidence of a struggling consumer with metrics such as outstanding 90+ day delinquency rates on credit cards and auto loans near the highs of the aftermath of the Global Financial Crisis.
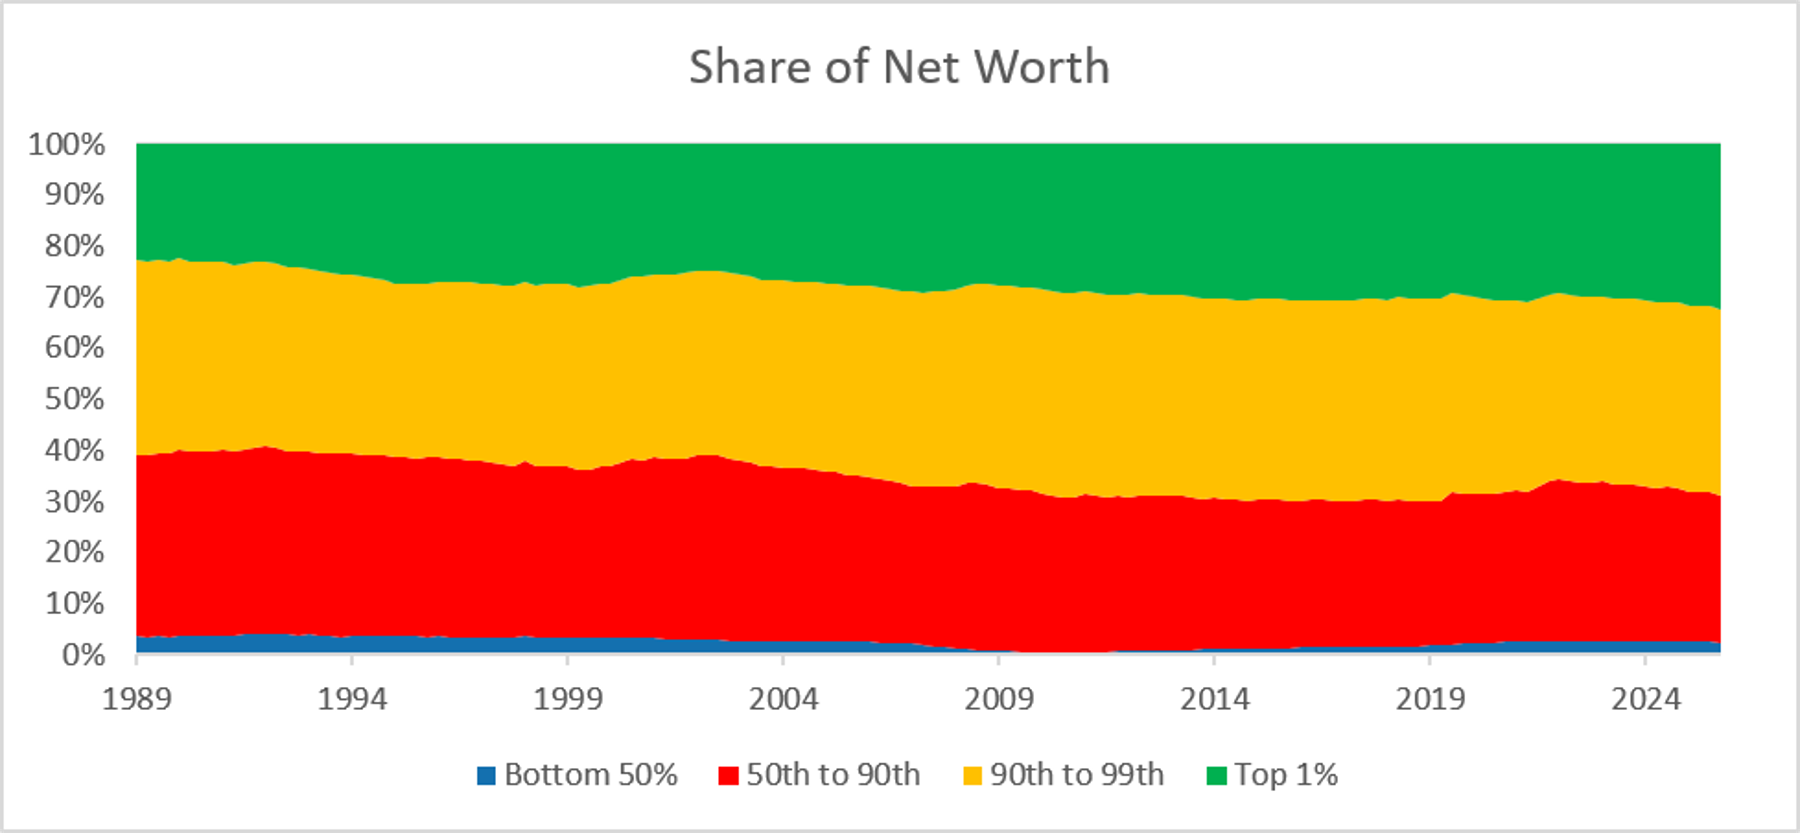
This issue of wealth inequality can be seen by Federal Reserve data that delineates the share of wealth in this country by percentiles. In 1989 the top 1% of wealthiest Americans owned 23% of the nation’s net wealth. Fast forward thirty-seven years and that share has climbed to 33% with the brunt of the net wealth shift burdening the 50th to 90th percentile cohorts. Adding up the data leads to the following points:
Wealth has increased in the United States due in large part to a booming stock market.
That stock market has introduced a wealth effect thereby enabling consumers to spend more as their net worth rises.
This wealth effect is concentrated in the top 10% of Americans, while the bottom 90% face headwinds from higher interest rates that make mortgages, credit cards, and auto loans less affordable.
Interest rates have risen in 2026 and yet the technology sector is largely unfazed as evidenced by a 37% year-to-date return.
Wealth is concentrated in the 10 largest companies making up 40% of the S&P 500.
The market is increasingly reliant on the commercial success of AI. As Hyperscalers tap debt markets to fund datacenter buildouts, higher interest costs will present higher hurdle rates for their investments. Should returns on the buildout prove unprofitable, a sharp deceleration in infrastructure spend is likely to adversely impact semiconductor companies.
Source: Board of Governors of the Federal Reserve System
This risk of the AI buildout potentially failing shouldn’t be taken as a forecast and much less as a fact. There’s an equally, if not more, legitimate argument for the positive impact AI can have on corporate profits. While it hasn’t materialized in productivity figures yet, we can see the effect of the investing boom on forecasted earnings. Through the end of September, analysts expect Q3 earnings for the S&P 500 to grow at 29.5% year-over-year driven by, you guessed it, the technology sector with expectations for profits to grow by 65% [7].
This isn’t to say there aren’t massive societal costs and benefits presented by AI that extend beyond the last line on an income statement. However, as investors our job is to deliver nuance in a world distorted by the loudest voices. Yes, there are issues and money doesn’t solve all problems, but used wisely, money can help you stay on the right side of the economic ledger. To the extent being intelligent with your money is a desirable pursuit, you may want to consider the following points when building portfolios in today’s environment:
Diversification is increasingly important for equities. Only owning the S&P 500 presents concentration risks that can be mitigated by investing in international and active management strategies.
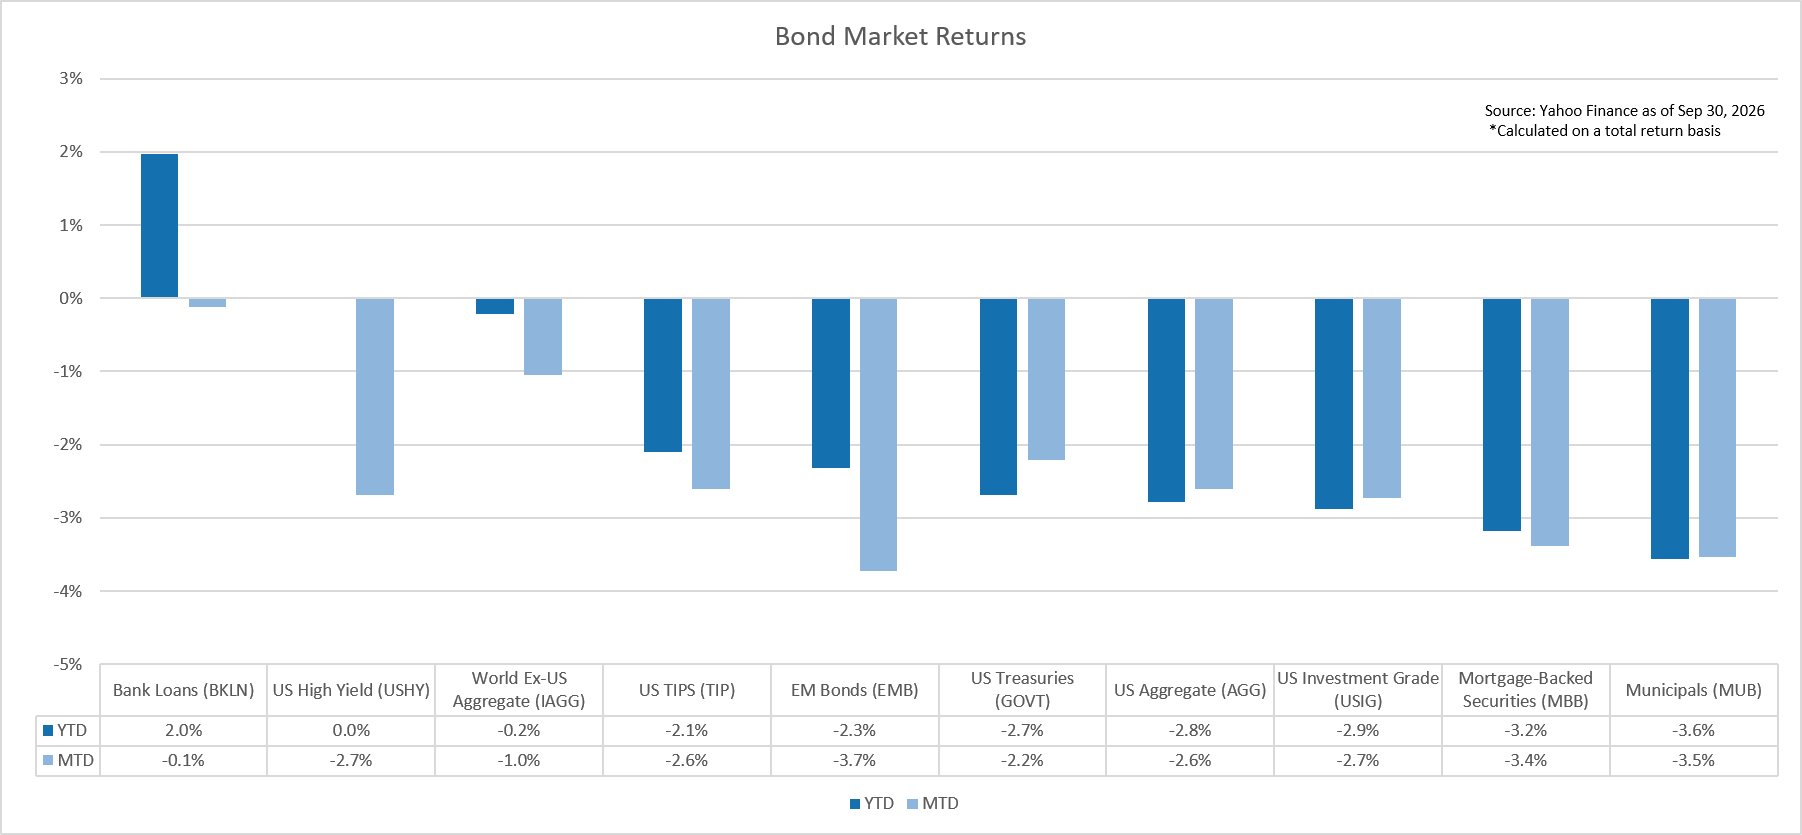
Long-duration bonds have been disproportionately hurt by rising interest rates. Owning shorter term paper coupled with skilled credit research can yield high income with limited interest rate risk.
Supply-chain tail risks have been a recurrent theme since the 2020 COVID lockdowns. Investing in diversifying strategies such as managed futures can help take advantage of this changing paradigm.
Appendix:
Sources:
Bessembinder, H. (2026, March 21). One hundred years in the U.S. stock markets. Arizona State University.
Warsh, K. (2026, August 28). In our time. Board of Governors of the Federal Reserve System.
Wilding, T.; Scott, J.R. (2026, September 30). Monetary policy through the lens of financial conditions. PIMCO
Christensen, Jens H.E.; Rudebusch, Glenn D. (2012, May). The Response of Interest Rates to U.S. and U.K. Quantitative Easing. Federal Reserve Bank of San Francisco
Hyman, D; Benahmed, A. (2026, September 24). The U.S. housing market becomes a more local story. PIMCO
Dugan, T; Graveley, J. (2026, June 26). Deciphering the K-shaped economy. Silicon Valley Bank
Butters, J. (2026, October 2). FactSet earnings insight. FactSet.
Disclosure:
This commentary is provided for informational and educational purposes only and should not be construed as investment, tax, legal, or accounting advice. The views expressed are those of Sella Wealth as of the date of publication and are subject to change without notice.
Past performance is not indicative of future results. All investments involve risk, including the possible loss of principal. References to specific securities, asset classes, sectors, economic data, or investment strategies are for illustrative purposes only and should not be considered a recommendation to buy, sell, or hold any security.
Economic forecasts, market outlooks, and forward-looking statements are based on current expectations and assumptions. Actual results may differ materially from those anticipated. There is no guarantee that any forecast, projection, or opinion discussed in this commentary will be realized.
Information contained herein has been obtained from sources believed to be reliable; however, Sella Wealth makes no representation or warranty as to its accuracy, completeness, or timeliness. Charts, statistics, and third-party research are provided for informational purposes and remain the property of their respective owners.
Asset allocation and diversification do not guarantee a profit or protect against loss in declining markets. Investors should consider their individual objectives, risk tolerance, and financial circumstances before making investment decisions.
Sella Wealth LLC is a registered investment adviser. Registration does not imply a certain level of skill or training. Advisory services are offered only to clients or prospective clients where Sella Wealth and its representatives are properly licensed or exempt from licensure. This commentary is not an offer to sell or a solicitation of an offer to buy any security or investment advisory service.
