

October 23rd, 2026
By Lotem Sella, CFA
What is risk? The term can mean a lot of things to a lot of people. Your friend might believe it’s extremely risky to eat oysters during a month not containing the letter “r” or in any state not located off the coast. You on the other hand may have a stronger constitution and will eat oysters anytime anywhere.
This same friend may have a different attitude towards investing too. She may believe holding anything other than stocks is unimaginable and doing otherwise would be foolish. You on the other hand may not be so comfortable with the riskiness of such investing.
So, what is risk? Risk is in the eye of the beholder. An outlook and comfort dictated by the collection of personal circumstances that life and the person undergoing it profoundly call a unique experience. Or perhaps I’m getting slightly carried away. Regardless, the point is risk is personal and what you may tolerate is different than other people.
In this article, we are going to explore the concept of risk capacity, which is the quantitative element of an overall risk profile. Future installments will cover risk tolerance, risk objectives, uncertainty, and how they all interact with one another. Risk capacity can be broken down by time horizon, withdrawal needs, and your holistic balance sheet. Understanding these factors can help bring clarity to your financial situation.
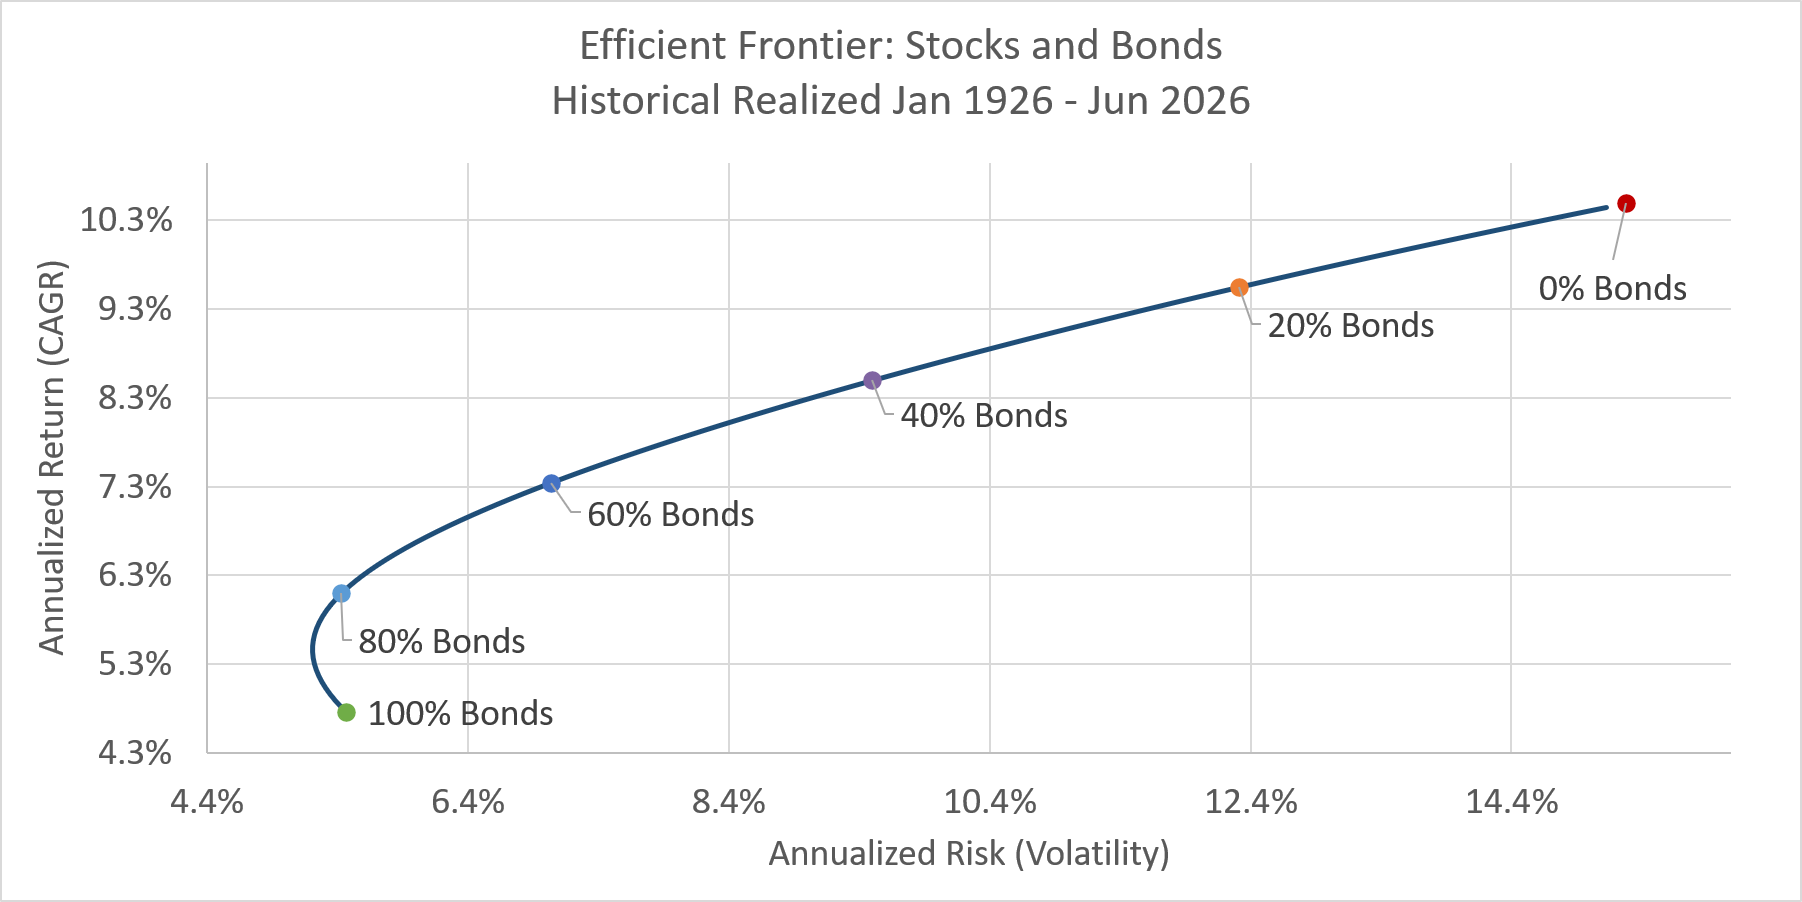
For the sake of simplicity, imagine you can only invest in two assets; stocks and bonds. Your portfolio’s level of risk is dictated by how many stocks vs bonds you hold. While it’s beyond the scope of this article to explain why stocks are riskier than bonds, suffice it to say the historical volatility of the assets support the claim. Below are the average annualized returns and volatility for different portfolios of US stocks and bonds from January 1926 through June 2026.
Source: Shiller Data
This graph highlights the concept that greater risk has historically resulted in greater return. However, this relationship is only accurate if you have the luxury of time to afford it. Remember, the data above is the average return for the past 100 years, which includes both bull and bear markets. Therefore, you must consider time as a factor in your risk capacity.
If you’re planning on making a down payment on a home next month, it’s a risky idea to invest those funds in the stock market. On the other hand, if you’re saving for a retirement that’s thirty years away, the historical data shows stocks always outperformed bonds over such a long-time frame. Herein lies a simple truth, the longer you can weather the storm the greater the likelihood you’ll get the long-term average. The shorter your time horizon, the more likely you’ll land within a wide range of outcomes.

Source: Shiller Data
So, one element of risk capacity is your time horizon. Are you investing for the short-term or the long-term? This can be complicated when you’re simultaneously withdrawing monthly living expenses while investing assets to last the rest of your life. To balance competing time horizons, investors often turn to portfolios that combine stocks and bonds.
By falling somewhere in the middle of an all stock or all bond portfolios, investors can target an expected risk level. This multi-asset portfolio limits the range of poor short-term outcomes while maintaining exposure to the long-term averages. To better understand which balance you should strike, it’s important to understand what your withdrawal rate is. For our purposes, this is defined as your initial annual withdrawal amount divided by your portfolio value.
Source: Shiller Data
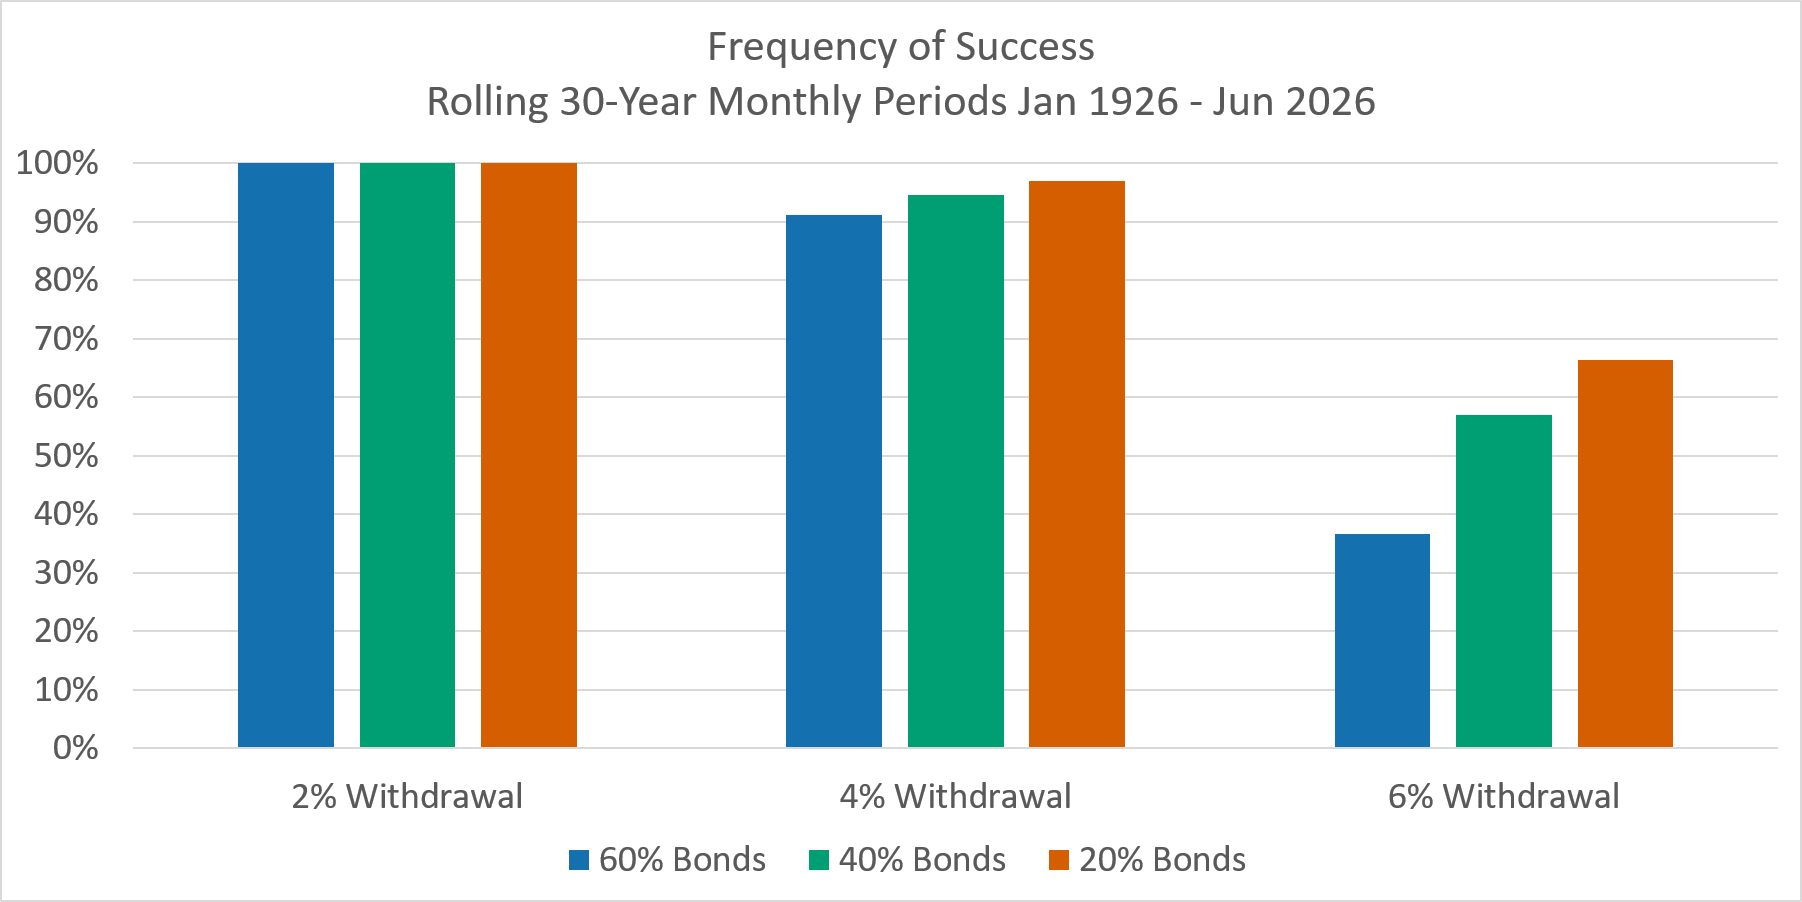
The chart above shows three different annual withdrawal rates for three different portfolios rebalanced to a target allocation monthly. Success is defined as the number of portfolios that survive a 30-year retirement while withdrawals increase monthly by the rate of inflation.
As you can see, the lowest withdrawal rate has a 100% success for all three risk profiles, indicating investors who don’t need as many distributions also don’t need to take as much risk. On the other hand, investors who have higher withdrawal rates face lower success rates with lower levels of risk. Said differently, if you’re going to have a high withdrawal rate, history suggests you should either increase your asset base, lower your withdrawals, take on more risk, or strike a balance between the three.
Withdrawal rates don’t paint the full picture, however. Two different investors might have similar account balances but different assets on their balance sheets. This can include assets such as real estate, future wages (shown as human capital below), and the value of future social security payments. Additionally, there can be liabilities such as debts and future insurance premiums. These items have inherently different risk characteristics that are dynamic through time. Therefore, your investment portfolio doesn’t exist in a vacuum, but rather as an element of a holistic planning approach.
Jane at age 50
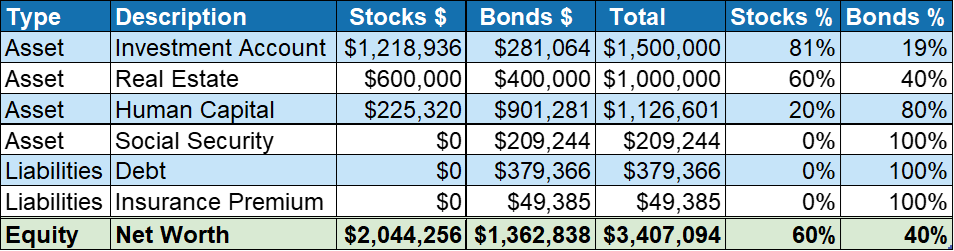
Consider the hypothetical example of Jane, a tenured college professor who is 50 years old and planning on retiring 15 years from now. She has both tangible assets (investment account and real estate) and intangible assets (future earnings and Social Security). Additionally, she has a mortgage with 15 years remaining and a term life insurance policy with another 10 years. By modeling the expected risk characteristics of these assets and liabilities, we can calculate the overall risk profile of her net worth.
Importantly, her net worth can be adjusted by the riskiness of her investment portfolio, as the other balance sheet items have a fixed risk profile. Given the safety of her job as a tenured professor and the bond-like characteristics of social security, in this example Jane has the capacity to take on a higher risk profile with her investments to balance her net worth allocation to a target 60/40 profile.
Jane at age 65
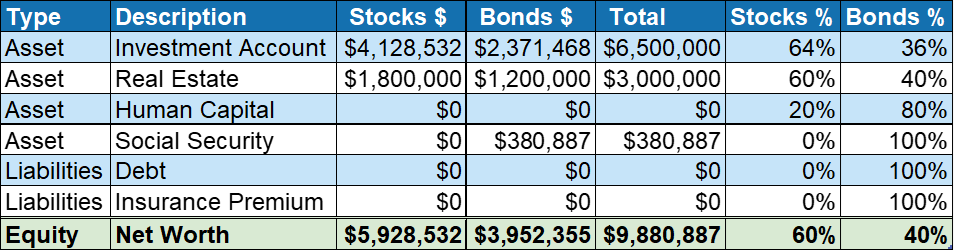
Fifteen years have passed and Jane is now retired. Her human capital, debt, and insurance premiums are down to zero, while the value of her other assets has risen. Given the change in balance sheet, Jane’s advisor is now recommending reducing the risk in her investment account. In this example, her target risk profile of 60/40 for net worth doesn’t change. Instead, her capacity for risk in the investment portfolio has lowered as the other items on her balance sheet evolved.
What is risk? It’s a unique characteristic to your financial situation. One way to uncover your target risk profile is by understanding your risk capacity. This can be partly observed by understanding your time horizon, withdrawal rate, and balance sheet. However, risk capacity is only a piece of the puzzle. To uncover the full picture, risk tolerance, risk objectives, and uncertainty must be understood as well.
Works Cited
Arnott, Amy C., et al. The State of Retirement Income: 2025. Morningstar, 3 Dec. 2025, static.twentyoverten.com/5b5730126af0247efe4f2066/zT8sbuFanVR/Morningstar-2025-State-of-Retirement-Income.pdf.
Bengen, William P. “Determining Withdrawal Rates Using Historical Data.” Journal of Financial Planning, Oct. 1994. Reprinted Mar. 2004, www.financialplanningassociation.org/sites/default/files/2021-04/MAR04%20Determining%20Withdrawal%20Rates%20Using%20Historical%20Data.pdf.
Idzorek, Thomas M., and Paul D. Kaplan. Lifetime Financial Advice: A Personalized Optimal Multilevel Approach. CFA Institute Research Foundation, 2024, rpc.cfainstitute.org/sites/default/files/-/media/documents/article/rf-brief/lifetime-financial-advice.pdf.
Khang, Kevin I., and Andrew S. Clarke. Safeguarding Retirement in a Bear Market. Vanguard, June 2020, www.vanguard.co.uk/content/dam/intl/europe/documents/en/whitepapers/safeguarding-retirement-bear-market.pdf.
Kitces, Michael. “Separating Risk Tolerance from Risk Capacity—Just Because You Can Afford to Take Risk Doesn’t Mean You Should.” Kitces.com, 3 Sept. 2014, www.kitces.com/blog/separating-risk-tolerance-from-risk-capacity-just-because-you-can-afford-to-take-risk-doesnt-mean-you-should/.
Shiller, Robert J. Shiller Data. shillerdata.com. Accessed 19 Oct. 2026.
Methodology
The analysis in this article is based on historical U.S. market data from the Shiller Data database spanning January 1926 through June 2026. The dataset includes historical stock prices, dividends, inflation, and U.S. Treasury yields. All portfolio returns, rolling returns, and withdrawal analyses are presented in nominal terms unless otherwise noted. Inflation data was used solely to increase retirement withdrawals throughout the withdrawal simulations.
Portfolio Risk and Return
The risk and return chart was constructed using hypothetical portfolios consisting of varying combinations of U.S. stocks and U.S. Treasury bonds.
Stock returns were calculated using a total-return series incorporating both price appreciation and reinvested dividends. Bond returns were modeled using a constant-duration 10-year Treasury approach derived from the historical 10-Year Treasury yield (GS10) series contained within the Shiller dataset. Portfolios ranging from 100% bonds to 100% stocks were evaluated.
For each allocation:
Monthly portfolio returns were calculated from the underlying stock and bond return series.
Portfolios were rebalanced to target allocations.
Annualized returns were calculated from the compounded monthly return stream.
Annualized volatility was calculated as the standard deviation of monthly returns multiplied by the square root of twelve.
Volatility is used as a proxy for investment risk and reflects the historical variability of portfolio returns.
Time Horizon Analysis
To evaluate the impact of investment horizon, rolling return calculations were performed across the following holding periods:
1 year
3 years
5 years
10 years
20 years
30 years
For each horizon, every possible historical starting date was analyzed. The resulting return distributions were summarized using the 95th percentile, 75th percentile, median, 25th percentile, and 5th percentile outcomes. This approach illustrates how the dispersion of historical outcomes changed as holding periods increased. All returns shown are nominal annualized returns.
Withdrawal-Rate Analysis
Retirement simulations were conducted using a hypothetical $1,000,000 starting portfolio and a 30-year retirement horizon.
The analysis assumed:
Monthly portfolio rebalancing
Withdrawals beginning at 2%, 4%, or 6% annually
Monthly withdrawal increases equal to observed inflation
Historical monthly stock and bond returns
Portfolio allocations consisting of 40/60, 60/40, and 80/20 stock/bond mixes
A simulation was considered successful if the portfolio maintained a positive value for the full 30-year retirement period. Historical success rates were calculated as the percentage of rolling retirement periods that met this requirement. The portfolio return calculations remain nominal; inflation was used only to adjust spending throughout retirement.
Balance-Sheet Analysis
The Jane examples illustrate a holistic approach to evaluating risk capacity. Rather than focusing solely on an investment portfolio, assets and liabilities were aggregated into a household balance sheet that included:
Investment assets
Real estate
Human capital (future earnings)
Social Security benefits
Debt obligations
Expected insurance premiums
Future cash flows were discounted to present values using assumed discount rates. Human capital, Social Security, and liabilities were assigned stock-like or bond-like characteristics based on their expected risk profiles. These classifications were then incorporated into a household net-worth allocation model to estimate the overall risk exposure of the balance sheet. The examples are hypothetical and intended solely to demonstrate how risk capacity can evolve through time even when an investor's target net-worth allocation remains unchanged.
Disclosure
This article is provided for educational and informational purposes only and should not be construed as investment, tax, legal, or financial planning advice.
The historical stock-and-bond illustrations and withdrawal analyses are hypothetical, not actual client results or forecasts. Past performance does not guarantee future results. Historical averages and instances of stocks outperforming bonds do not ensure similar outcomes over any future holding period. All investing involves risk, including loss of principal. Bonds are subject to interest-rate, inflation, and credit risk; diversification, asset allocation, and rebalancing do not guarantee a profit or prevent losses.
The withdrawal illustrations use the article’s stated assumptions, including monthly rebalancing, inflation-adjusted withdrawals, and a 30-year retirement horizon. A historical success rate describes the proportion of tested periods in which a portfolio was not depleted; it is not a probability or guarantee of future success, even when the historical rate is 100%. Results depend on the data, periods, and calculation methods used. Taxes, advisory fees, investment expenses, and transaction costs can reduce returns and sustainable withdrawals; their treatment is not specified in this article. Actual outcomes also depend on return sequence, inflation, longevity, spending flexibility, and individual circumstances. Taking more investment risk does not necessarily resolve a retirement funding shortfall.
Jane’s balance sheets are hypothetical educational examples, not actual client information or projections of achievable wealth. Values assigned to future earnings, Social Security, real estate, debts, and insurance premiums, and their stock-like or bond-like allocations, are simplified modeling assumptions rather than actual holdings of stocks or bonds. Human capital and future benefits are not liquid investment assets, and their values and risk characteristics can change. The illustrated 60/40 net-worth target and investment-account allocations are not recommendations. Risk capacity alone does not determine an appropriate portfolio; personal risk tolerance, goals, liquidity needs, and other circumstances must also be considered. References to third-party research provide background and do not imply endorsement of this article or its illustrations.
